Query app - how to use
The goal for our query tool is to be more user-friendly and make querying immPort data in an organized and visual way compared to the initial tool
You will find filters and tables about Studies, Participant, Events/Samples, Assays/Assessments and Signatures. Each filter applied queries each table and show the results. So you can apply a filter labeled for Participants and it will still query the other 4 tables depending on the resulting participants list.

When you first enter the tool here, you get a page with only the 4 sets of filters for Studies, Participants, Events/Samples and Assays/Assessments, like the image shown above, and you can decide to apply filters already if you know what you are looking for, or go straight to the results page with no filter applied by clicking on Search, like the image shown below.
Filters
There are 4 sets of filters, for Studies, Participants, Events/Samples and Assays/Assessments.
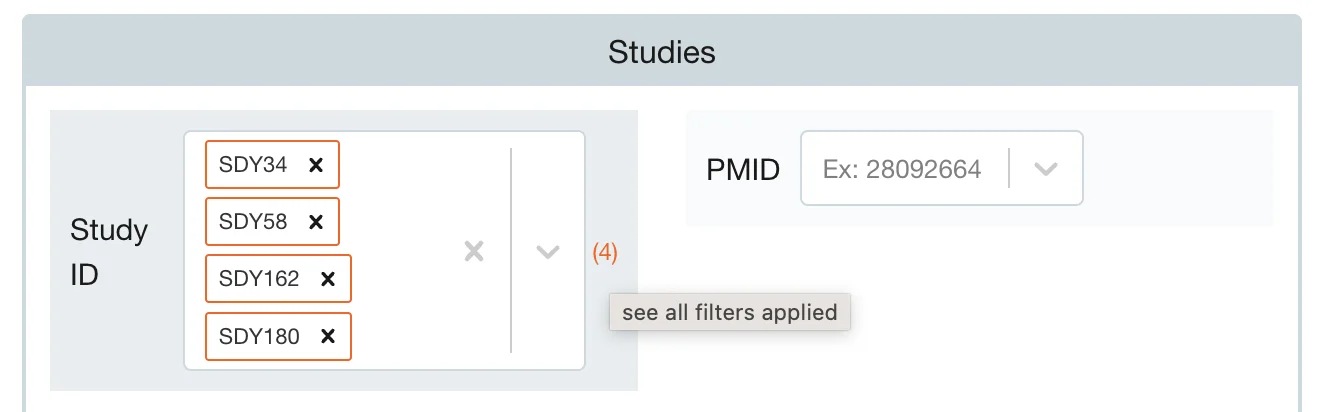
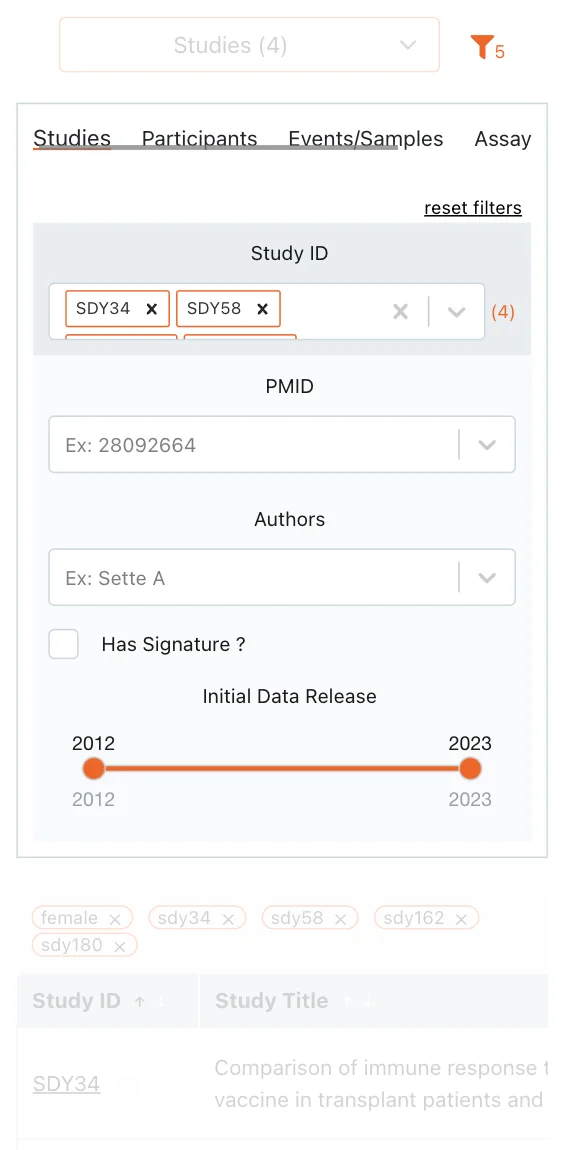
- Studies can be filtered on study ID, PMID, authors, initial date release and if they currently have signatures associated with them.
- Participants can be filtered on participant ID, biological sex, age and race.
- Events/Samples can be filtered on event type, event category, material and disease name.
- Assays/Assessments can be filtered on tissue sampled, sample type, assay type and target entity.
Each dropdown allows you to search by typing or scrolling, click to select. The number of selected elements appears on the right side of the dropdown. If the selection is very long and you want to expand to see all the elements selected, click on that number and you’ll get the full list.
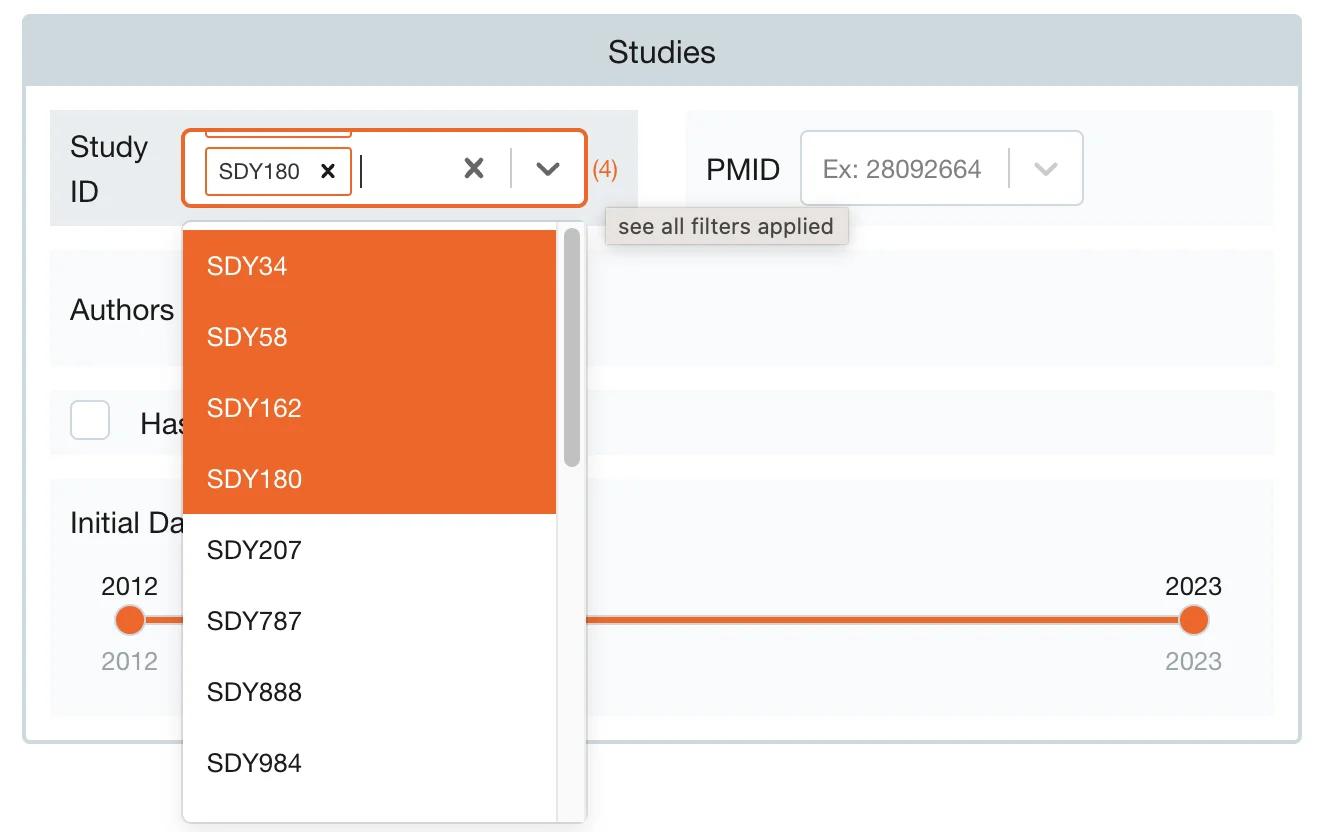
A filter applied appears with a darker blue background.
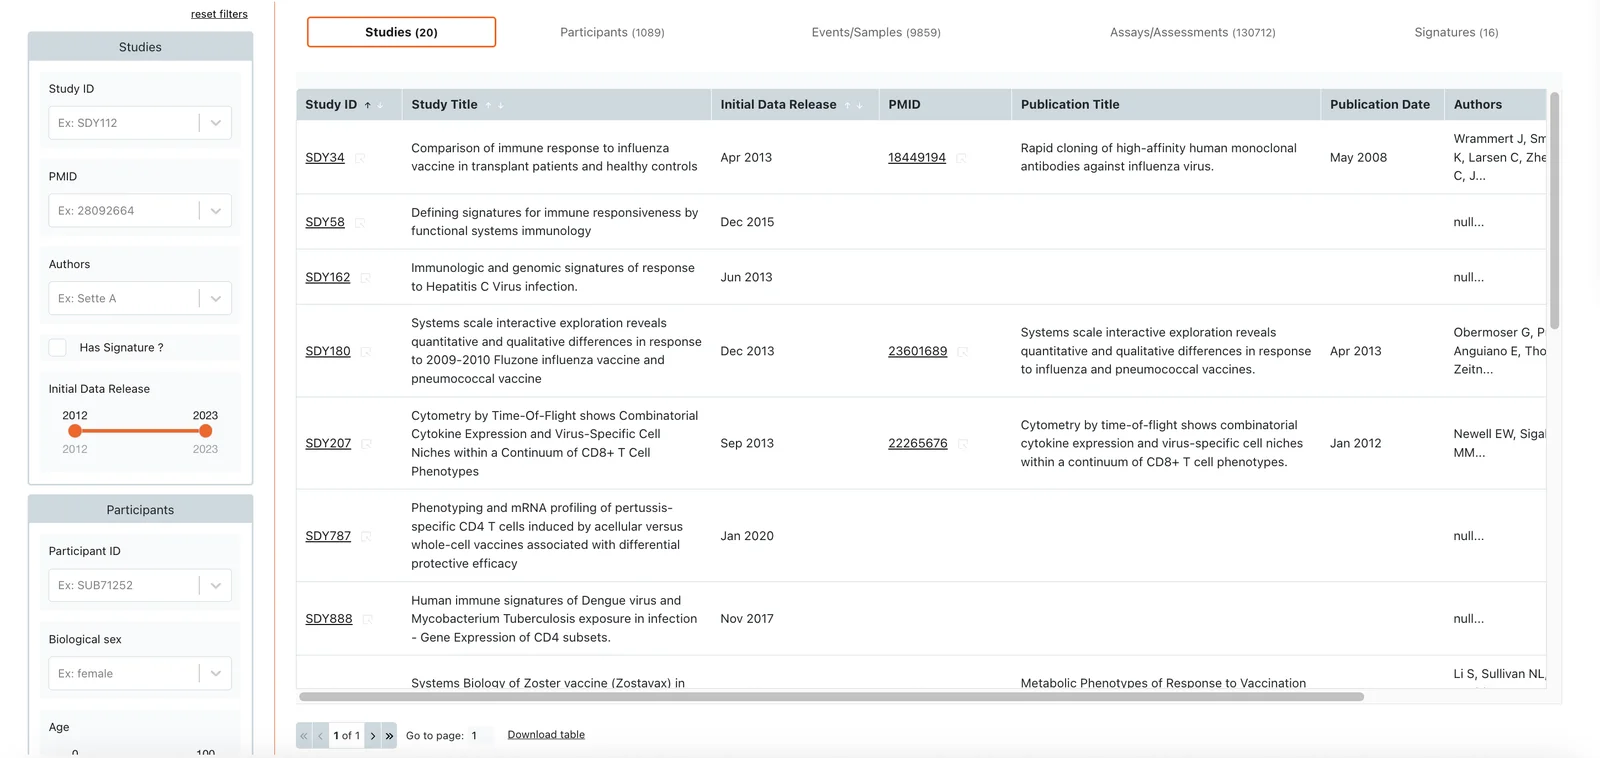
Once you decide which filters to apply (or not) by clicking on Select, you’ll be redirected to the result page. It has the same filters on the left side, and the resulting tables on the right side. When on this page, if you make new changes to the filters, remember to click on the Apply Filters button on the top right of the page. It will automatically appear if you made changes to the filters and they need to be applied to generate the new results. Click on reset filters to reset the search to no applied filters.
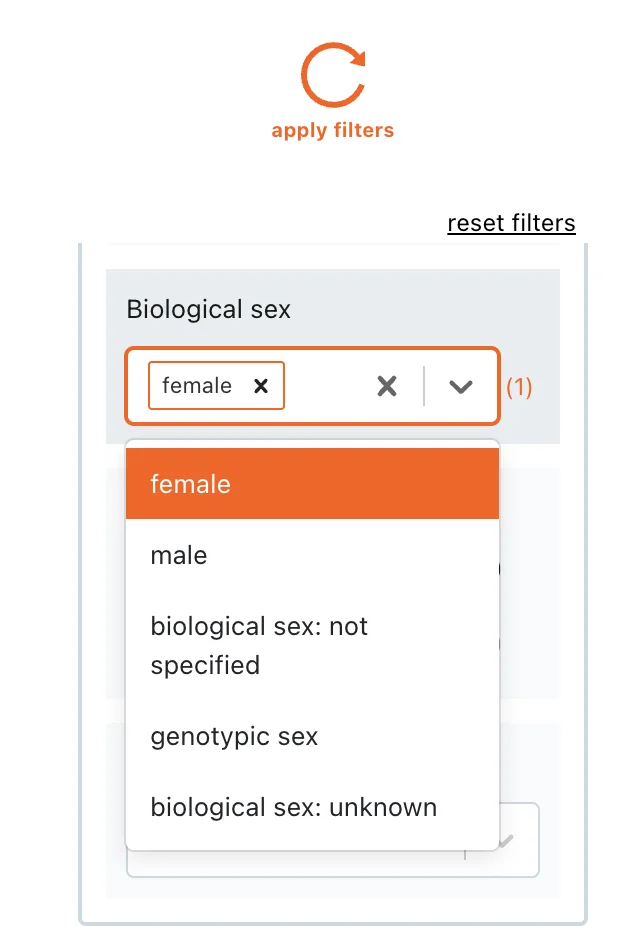
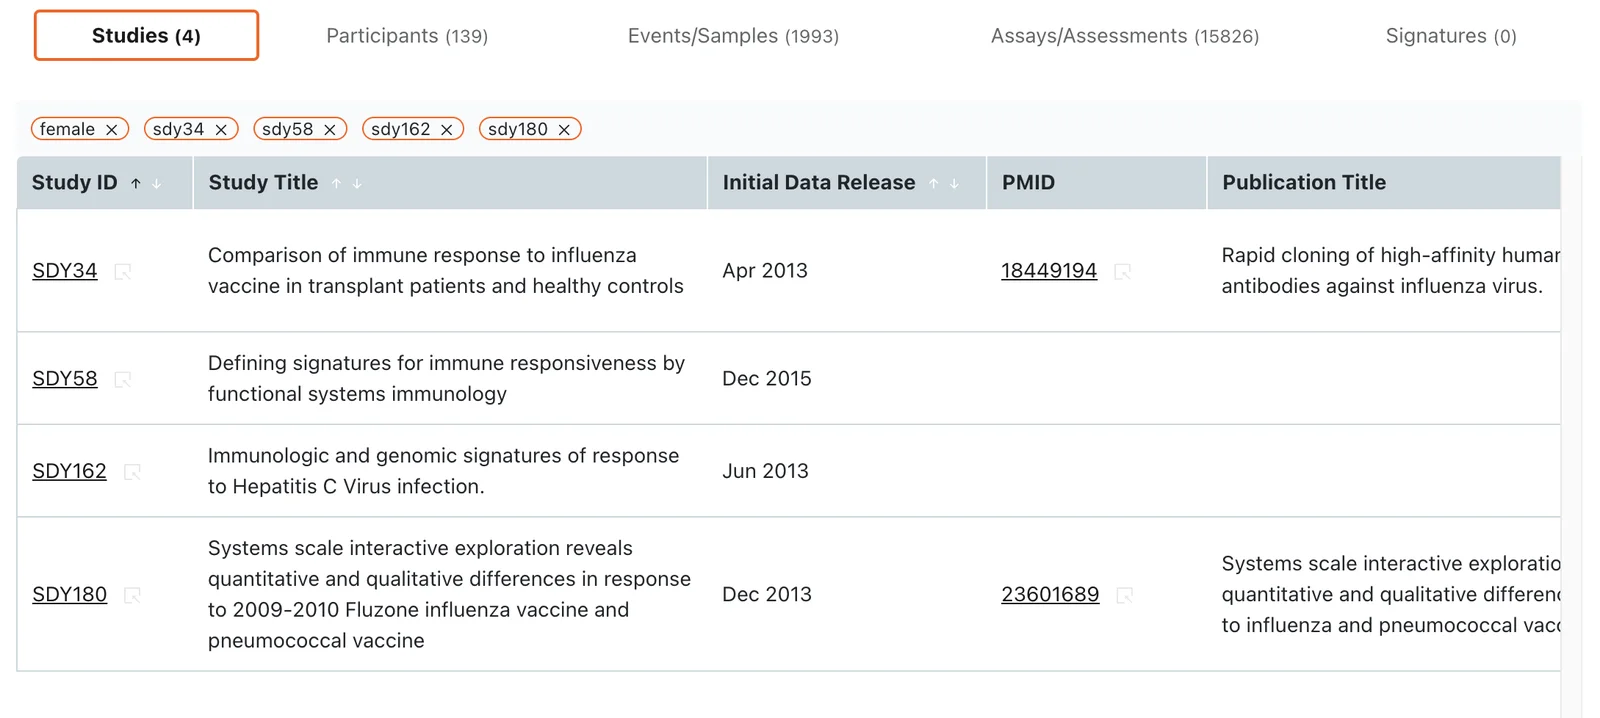
Filters applied are distinct by their darker blue color and the orange number on the side showing the number of selections next to the dropdowns. Applied filters also appear above the tables as a reminder, and you can deselect them by clicking on the cross next to it.
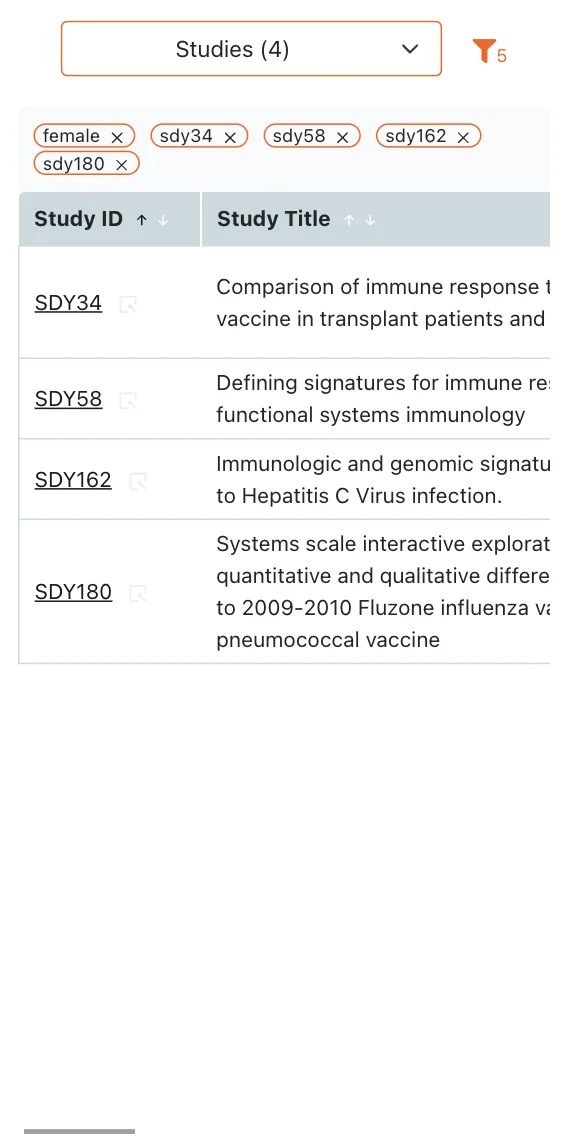
If you are using a phone, access the filters by clicking on the filter icon on the top right side on your screen. The number of applied filters will appear next to the filter icon and the applied filters will also appear above the table. The functionality is the same, whenever you make a filter change, remember to click on apply filters button.
Tables
There are 5 tables: Studies, Participants, Events/Samples, Assays/Assessments and Signatures.
Each table's columns can be sorted if you see the up and doan arrows next to the column's title.
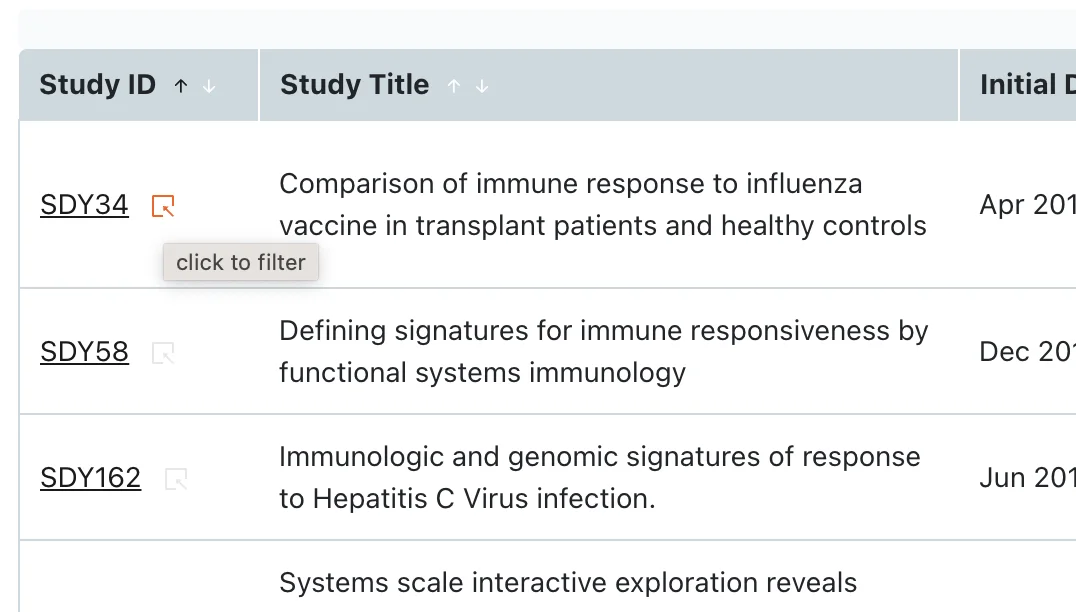
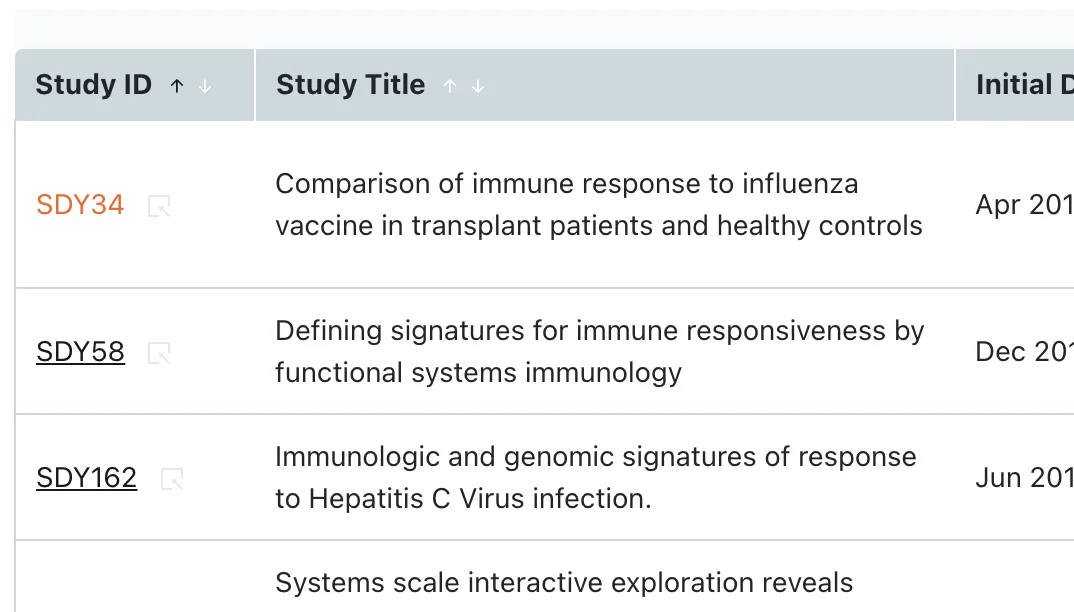
If you see a table cell with an icon next to it, it means you can click on it and apply as a filter. For example, cells with a Study ID can be clicked and it will apply the Study ID as a filter to all the tables.
A cell with a content underlined means it will open a link to a new page. For example Study IDs are underlined and clicking on them will open the individual study page where you will be able to see additional information related to only this study.